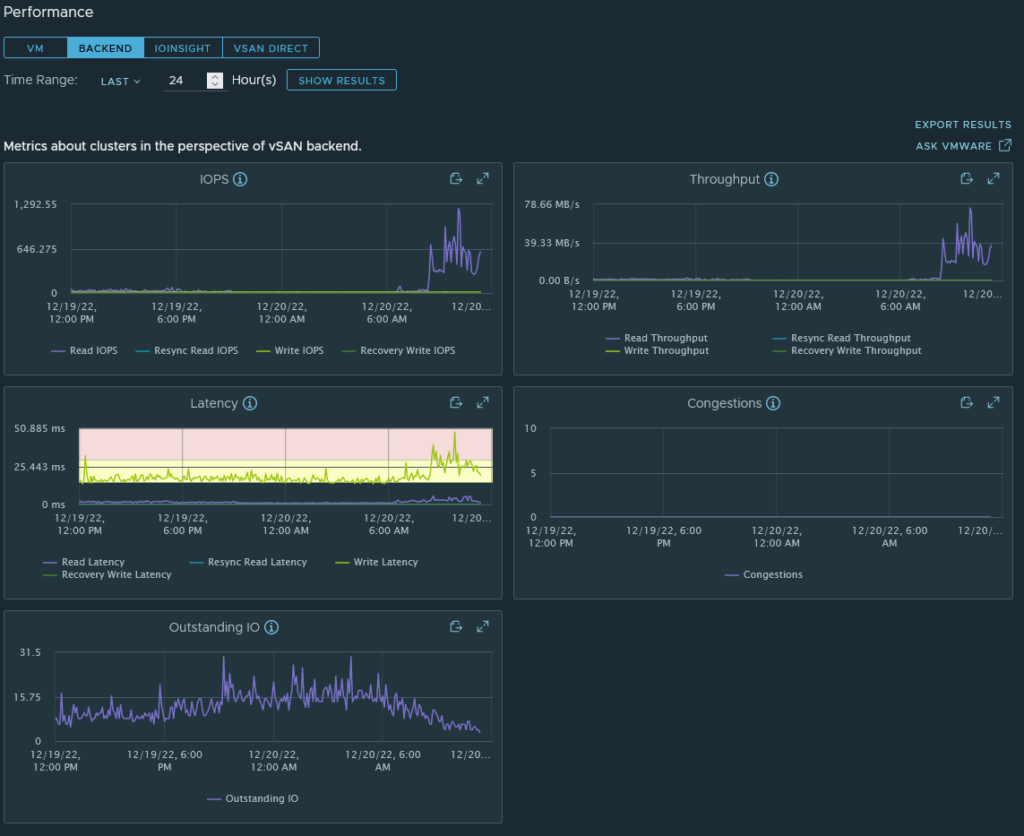
After setting up my vSAN instance and deploying a test workload (a large VM that synchronises everything from my home PC and laptop using Resilio Sync), I noticed that disk throughput was far below what I’d expect (indicated around 3-4MB/s). Looking at the vSAN performance metric (Monitor>vSAN>Performance), I also noticed the following:
1) Latency would spike wildly from 5ms up to 3000ms (!!!!)
2) Congestion was randomly spiking
3) Outstanding IO was regularly 100+
4) IOPs was 100-300
5) Backend throughput was usually below 10MB/s.
Granted, this is a lab environment using non-standard hardware, but I decided to do some digging and try to determine the possible cause (and if there was something I could do to address it). Here’s what I found:
Capacity Disk Types
My capacity tier was a mix of disks (all identical in capacity but from different vendors). Most of these disks were SMR (Shingled Magnetic Recording). SMR disks use data tracks stacked on top of each other to increase density, however for modification/deletion of existing data, this means all of the stacked data in a single sector needs to be re-written (which has a performance penalty associated with it). SMR disks normally have a large cache which is used to overcome this limitation (and prevent drops in throughput), however this cache fills up under sustained writes, causing a massive drop in throughput.
SMR disks wouldn’t be used in an enterprise environment – they’re common in domestic use because they are cheaper than conventional magnetic drives (CMR). They’re intended for archival/intermittent use, rather than throughput-heavy applications.
To address this, I swapped out the entire capacity tier, replacing all disks with a single Seagate Exos 18TB CMR drive per host. These are enterprise-grade disks designed for handling sustained/heavy throughput.
Host Disk Controller Type / Queue Length
Another important link in the vSAN performance chain is the Disk Controllers used. vSAN has minimum requirements around Disk Controllers, with a queue length of 256.
The HP Microserver Gen8 (my platform of choice for this vSAN cluster), uses the HP B120i Disk controller. From Duncan Epping’s vSAN blog post about Disk Controller queue depths, it’s been documented that this controller has a queue depth of 31 and doesn’t meet the vSAN minimum requirement (and would be an unsupported configuration).
I could address this by fitting an upgraded disk controller to each host, but as the Microserver only has one PCIE slot, I’d need to remove the 10Gb NIC from each server accordingly to make this work. I want to retain the extra pNICs for NSX, so this isn’t an option.
Some further reading on why queue depths matter and why they can impact a production environment is here, from an RCA of an outage in a customer’s environment.
Network Fabric/Connectivity
Looking at the pNIC metrics (Monitor>vSAN>Performance>Physical Adapters), it was also apparent that there was a number of packet errors being shown – there was dropped packets being indicated across the active vSAN NIC on each host. When I logged onto the network switch connecting these hosts, I couldn’t see any input/output errors on the interfaces, but I could see output drops. Clearing the counters resulted in the numbers incrementing straight away, so this is an ongoing problem rather than a historical one:
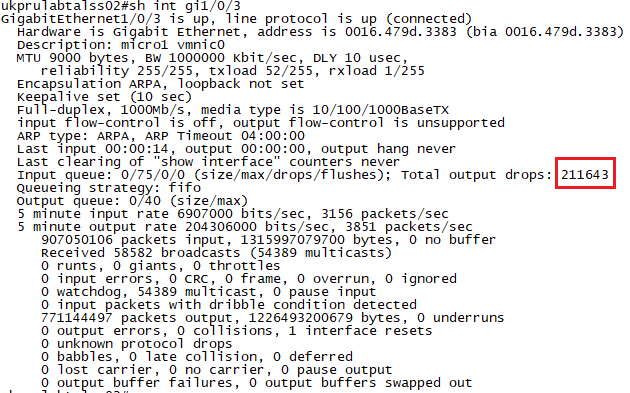
Running a “show mls qos int gi1/0/3 statistics” showed lots of drops in queue3:
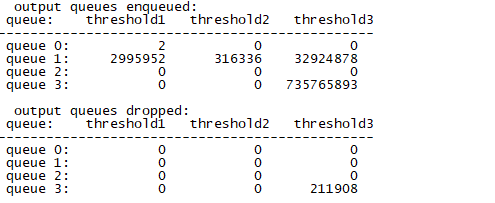
What does this mean to a non-network guy? An explanation follows 🙂
The switch I’m using to provide network connectivity to these hosts is a Cisco 3750G (WS-C3750G-24TS-1U). This is a Gigabit-capable L3 switch, first released in 2003 (and went EOL in 2021).
This switch was intended as a LAN access switch for branch/campus use, rather than as a datacenter device. As a result, it was never intended or built to provide capability to support high-throughput applications. Compared to modern devices, it has small buffers and limited QoS (quality-of-service) features that can be used.
Reading up, it appears I’ve hit a common issue with this switch. Hammering lots of traffic through the NICs causes the buffers to be overwhelmed and for traffic to drop. The buffer size cannot be increased, and enabling QoS would cause the switch to reduce the buffer size by allocating memory for QoS use (all of the articles I’ve found regarding this issue recommend disabling QoS for this reason).
When I repatched all of the pNICs to my other lab switch – a Cisco 4900M (a switch designed for datacentre use), this issue disappears. Using either the Gigabit or TenGigabit NICs, the cluster can hammer traffic across the interfaces for days without a single drop being recorded.
Impact of changes
Replacing the disks and the network switch resulted in a latency decrease to under 50ms, a throughput increase to over 100MB/sec and a drop in congestions and dropped packets. There was still a substantial amount of outstanding IO recorded regularly, but I’d put this down to the lightweight disk controller (which I can’t really replace without sacrificing network connectivity).
Conclusion
Whilst vSAN is a software-defined SAN solution, the performance and stability of it is very much dependent on the hardware used, not just from a host perspective (disks, memory, processing power, disk controllers, NICs etc) but also from a network fabric perspective – issues with the configuration or provision of your network fabric can adversely affect the performance of your storage.